- saas acquisition strategy
- saas marketing
- customer acquisition
- growth operations
- cac payback
SaaS Acquisition Strategy Playbook for Growth Teams
By Crescade · · 16 min read
Build a SaaS acquisition strategy that lowers CAC, compounds over time, and connects paid, organic, and lifecycle channels into one measured system.
A 40-person Series B SaaS company can have strong traffic, a full experiment backlog, and a capable paid media team, yet still watch acquisition efficiency deteriorate. The familiar pattern is a CAC dashboard that has worsened for several quarters while pipeline coverage gets thinner. The right response isn't automatically to cut Google Ads, publish more content, or hire more salespeople. A durableSaaS acquisition strategy connects paid demand capture, organic search, product-led growth, lifecycle follow-up, CRM stages, and revenue measurement around one question:which constraint is extending payback or lowering lead quality?
Table of Contents
What the 2026 Benchmarks Say About SaaS Acquisition
Choosing the Right Channel Mix by Motion and Stage
Unit Economics Every SaaS Team Must Calculate First
Creative and Landing Page Testing That Moves Revenue
A Measurement Plan Across Ads, SEO, and CRM
Running Acquisition as a Growth Operations System
Why SaaS Acquisition Costs Keep Rising
A SaaS funnel can show healthy click-through rates while revenue efficiency deteriorates. Google Ads becomes expensive, LinkedIn delivers too few qualified leads, and organic traffic arrives too slowly to support the quarter. Treating each channel as a separate budget problem hides the handoffs between demand capture, product usage, sales, and lifecycle follow-up.
The pressure appears downstream. B2B SaaS customer acquisition costs have risen40% to 60% since 2023, while the average sales cycle has reached134 days, compared with 107 days in 2022, according toSaaS customer acquisition cost benchmarks. The median company now spends about$2.00 in sales and marketing to generate $1 of new ARR, up14% year over year, from the same benchmark summary.
That operating environment makes volume a weak target. A cheap signup that never activates can consume more capacity than an expensive lead that becomes a qualified opportunity. Last-click reporting can also credit a campaign that depended on organic research, sales support, or lifecycle email before conversion.
Find the constraint before changing spend
Underperforming funnels commonly show three connected failure points:
- Targeting sits too far upstream of intent. The audience recognizes a category problem but is not actively evaluating a solution.
- Lifecycle follow-up loses users between trial and paid. Acquisition receives credit for the signup, while activation and time-to-value lack a clear owner.
- Creative no longer matches buyer language. Ads and landing pages describe features while prospects search for outcomes, risks, or workflow improvements.
Before reallocating budget, identifywhere the actual constraint sits and which channel reinforces it or masks it. Weak activation means more traffic will multiply waste. A bottleneck in SQL creation may require better qualification or sales handoff, rather than a different trial campaign.
A connected system gives each channel a job. Paid search captures existing intent, SEO builds owned demand, PLG turns product usage into evidence, and lifecycle marketing moves users toward value. Measure their combined effect through lead quality, conversion between stages, and payback period. TheSaaS acquisition cost framework helps separate channel cost from funnel economics, so blended CAC does not become the only diagnosis.
What the 2026 Benchmarks Say About SaaS Acquisition
A paid campaign can look efficient in the dashboard while producing little revenue. The 2026 benchmark summaries support a different planning standard: evaluatecapital efficiency, payback, and downstream conversion alongside lead volume.
The cost-of-growth data cited above points to a tighter margin for error. CAC has risen sharply since 2023, sales cycles are longer than in 2022, and sales and marketing spend per dollar of new ARR has increased. A channel that produces fast leads but weak opportunities can therefore consume budget while its surface metrics remain healthy.
Paid search needs an intent split. One published B2B SaaS benchmark reports non-brand search at$13.75 CPC, 3.60% CTR, and about $207 per lead, while brand search averages$3.12 CPC, 22.21% CTR, and about $34 per lead. TheGoogle Ads benchmarks for B2B SaaS figures show why brand and non-brand campaigns need different success thresholds and budget decisions.
A separateSaaS Google Ads benchmark reports search campaigns at about$95 CPA, 1.5% CTR, 1.8% conversion rate, and 4.2x ROAS.B2B Google Ads benchmark data also notes that non-branded search can take39% of budget while delivering 78% ROAS. Spend scale and efficiency measure different outcomes, so neither should stand in for qualified pipeline or retained revenue.
Use benchmarks as a planning reference
The table uses only the provided stage-specific payback ranges. It does not fill missing CAC or organic-pipeline figures with estimates.
| Stage | Median Blended CAC | Payback Period | Organic Share of Pipeline |
|---|---|---|---|
| SMB or self-serve | Not specified in the verified data | 6 to 12 months | Not specified |
| Mid-market | Not specified in the verified data | 12 to 18 months | Not specified |
| Enterprise | Not specified in the verified data | 18 to 24 months | Not specified |
TheSaaS customer acquisition metrics reference says many benchmark sources converge on a CAC payback target under12 months, with expectations varying by motion and segment. Use that boundary with gross margin and cohort behavior, then judge whether paid demand, owned content, product onboarding, or lifecycle work improves the combined payback.
A useful benchmark comparison is therefore motion-specific. Track lead quality, activation, conversion between stages, and retained revenue, then cut channels that cannot meet the required payback even when they generate inexpensive leads.
Choosing the Right Channel Mix by Motion and Stage
A channel mix should reflect two variables:buyer intent signal andpayback period. The channel that creates the most leads isn't necessarily the channel that creates the fastest path to cash.
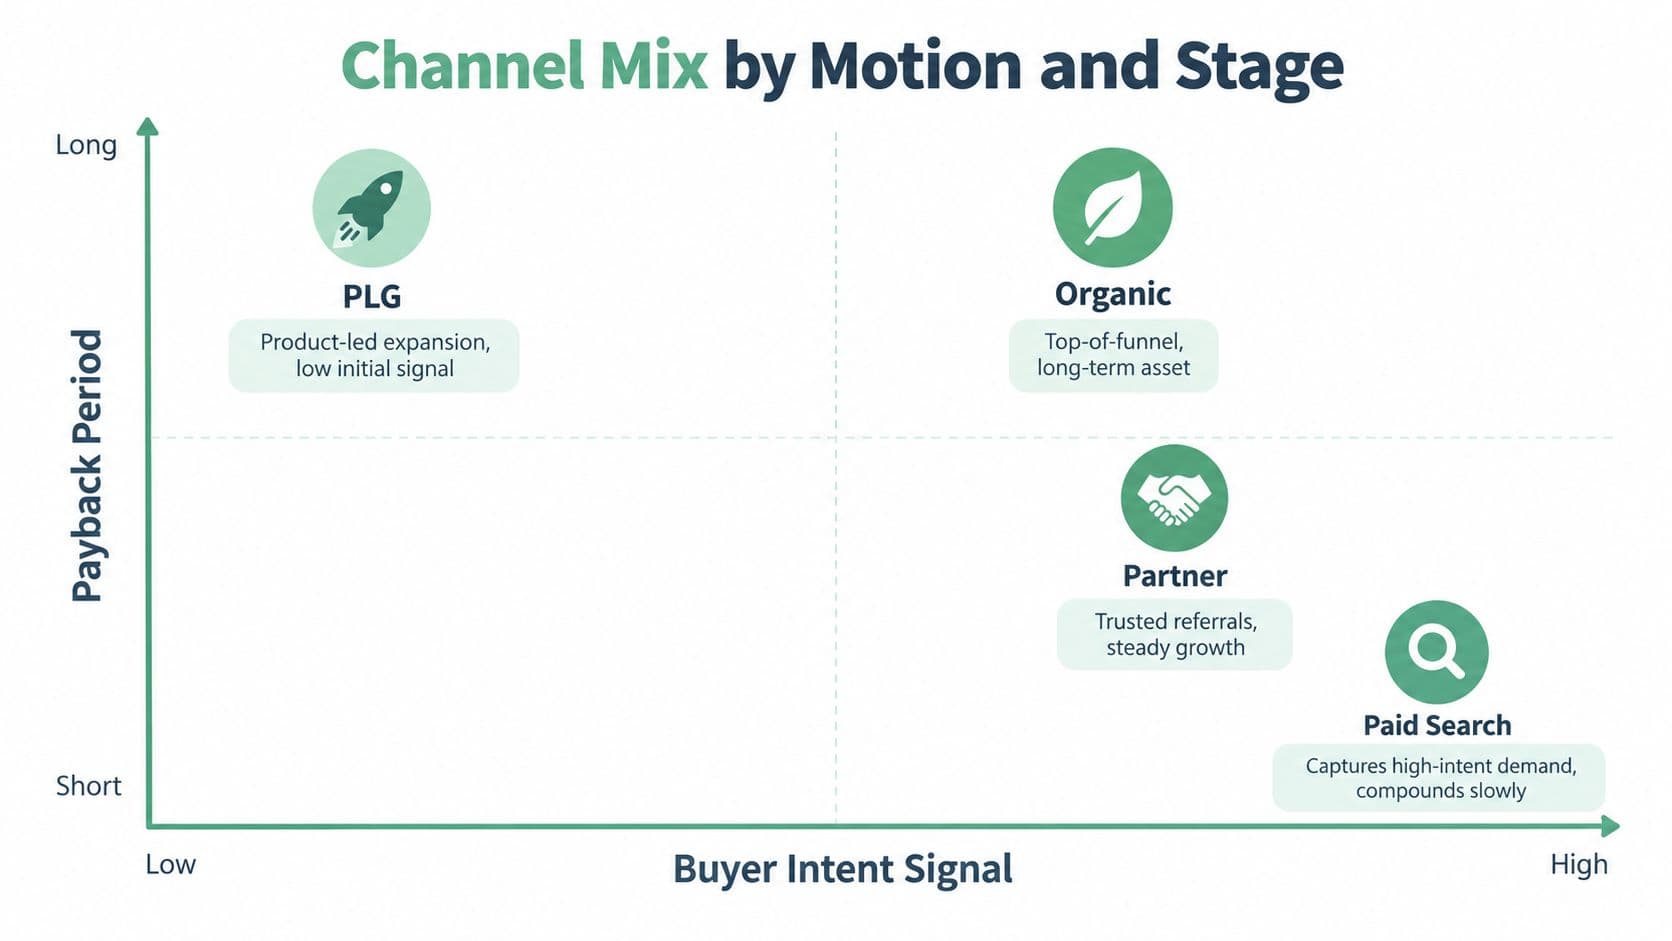
Paid search sits close to active demand. It can capture a buyer already looking for a category, use case, or alternative, but the pipeline usually stops when spend stops. That makes it useful for near-term demand capture, not a substitute for building owned demand.
SEO and community-led organic channels work differently. They compound through content, internal linking, brand familiarity, and repeated exposure, but they require patience and careful intent selection. Broad informational traffic may create reach without creating qualified pipeline. Comparison, use-case, integration, and problem-specific content generally gives the sales team stronger context.
PLG is a motion that uses existing resources, but its initial intent signal can be difficult to read. A signup matters less than an activation event, such as completing a core workflow, inviting a teammate, or connecting an important integration. Partner channels also depend on quality. A trusted referral can shorten evaluation, while a poorly matched audience creates low-quality leads that consume follow-up capacity.
Match the mix to the operating stage
A practical starting rule looks like this:
- Early-stage teams with fewer than 50 customers: anchor on one paid intent channel and one narrow PLG surface. Keep the system simple enough to learn from every conversion.
- Mid-stage teams: add SEO and lifecycle marketing once the activation path is understood. The objective is to improve the value of traffic already being acquired.
- Late-stage teams: layer partner programs and ABM motions over a functioning funnel. These channels require stronger account definitions, handoffs, and revenue reporting.
Treat the mix as a portfolio. Paid search may protect near-term pipeline, SEO may build future efficiency, PLG may lower sales dependence, and partners may expand reach through trusted audiences. Allocate according to how each motion improves the next quarter's payback, not according to which channel has the most impressive top-line dashboard.
Unit Economics Every SaaS Team Must Calculate First
Scaling a SaaS acquisition strategy before checking unit economics can turn efficient growth into a cash drain. Calculate performance bychannel, customer motion, and cohort. A blended figure is easy to report, but it can hide which investment is consuming cash.
Start with gross margin per customer. Subtract the direct cost of delivering the service from revenue, then use that margin, rather than total revenue, to estimate CAC recovery. This gross-margin floor matters when comparing a self-serve customer with a sales-assisted account.
Calculate CAC separately for self-serve and sales-assisted motions. Include paid media, sales support, agency or contractor costs, marketing technology, creative production, and relevant labor. Calculate ARPA or ACV for the same segment. A self-serve monthly plan and an enterprise contract need separate denominators.
| Metric | Formula | Healthy Benchmark |
|---|---|---|
| Gross margin per customer | Revenue minus direct cost of service | Use the actual margin for the motion |
| CAC by channel | Total channel-attributable sales and marketing cost divided by new customers | Review by channel and cohort |
| ARPA or ACV | Revenue divided by customers, monthly or annually | Segment-specific baseline |
| LTV to CAC | Customer lifetime value divided by CAC | At least 3:1 is a common benchmark, from SaaS pricing strategy guidance |
| CAC payback period | CAC divided by monthly gross profit per customer | Set a target that fits cash capacity and the motion |
Use thecustomer lifetime value calculation guide to standardize retention, revenue, and margin inputs before comparing channels.
Separate payback from the ratio
LTV to CAC is a ratio. Payback measures cash timing. A strong ratio can still create a cash problem when acquisition cost returns slowly, especially if sales cycles and implementation work consume resources before revenue arrives.
Blended CAC can also create a false trade-off. Paid social may look acceptable because organic search contributes high-converting customers to the same aggregate number. Reporting them together can lead the team to cut the channel that compounds while leaving the expensive one untouched.
Review payback by cohort and channel, then set explicit stop conditions. If payback exceeds18 months, or LTV to CAC falls below2.5x, scale nothing until the team identifies the cause. Check targeting, activation, pricing, handoff quality, gross margin, and retention before increasing acquisition volume. A channel should earn more budget by producing qualified customers at an acceptable payback, not by inflating lead volume.
Creative and Landing Page Testing That Moves Revenue
Creative testing only matters when it changes revenue-stage conversion. A higher click-through rate can be a negative result if the extra clicks come from people who don't activate, request a qualified demo, or become paying customers.
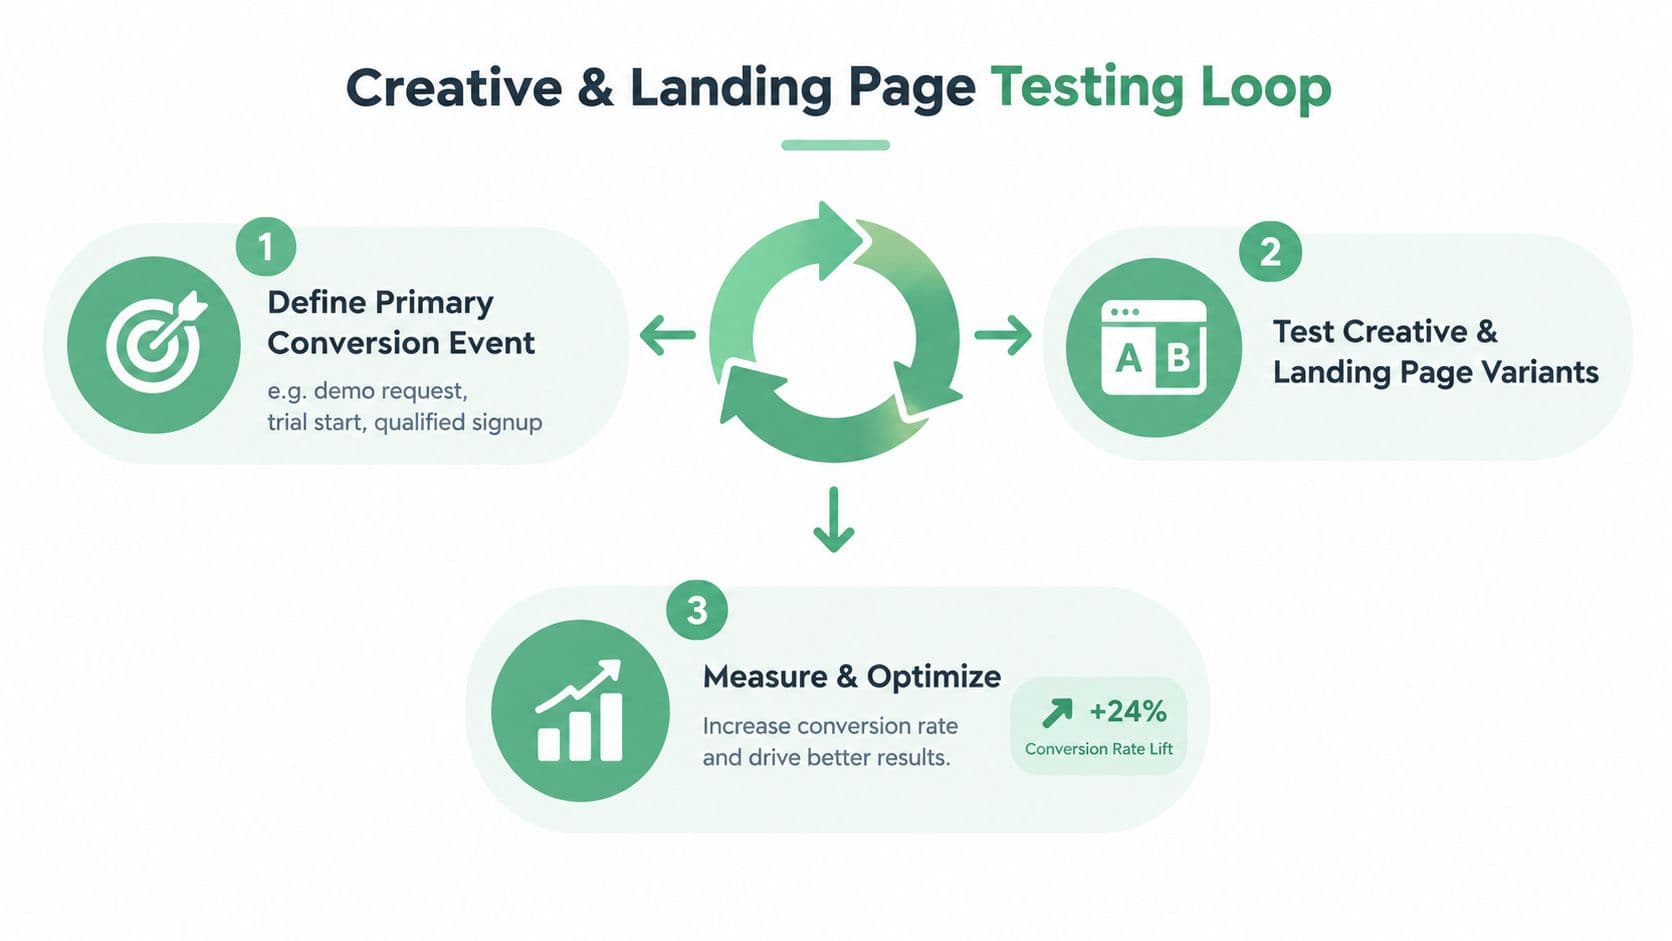
Give every landing page one primary conversion event:demo request, trial start, or qualified signup. Pair it with one stage metric that helps explain behavior, such as scroll depth, time on page, or pricing-section view. Without that pairing, the team can't tell whether a page is failing because the offer is weak, the audience is wrong, or the page doesn't communicate value.
Build a clean testing loop
Test one meaningful variable at a time. The strongest candidates usually include:
- Headline promise: Match the page to the problem the visitor is actively trying to solve.
- Hero image or product view: Show the workflow that makes the benefit concrete.
- Social proof placement: Put evidence near the decision point rather than below unrelated copy.
- CTA language: Describe the next useful action, not an abstract commitment.
- Form length: Remove fields that sales or qualification doesn't use.
For paid traffic, separate message-match tests by ad set. If one ad promises faster reporting and another promises simpler team collaboration, the landing pages should answer those specific promises. Sending both audiences to one generic page makes the conversion result difficult to interpret.
Score variants on the conversion event that matters. CTR is an input metric. Qualified signup rate, demo quality, activation, and opportunity creation tell you whether the message attracts the right buyer. A louder hero can increase attention while reducing form completion, so don't promote a winner until the downstream evidence supports it.
A weekly testing cadence works when the backlog is disciplined. Rank ideas by expected funnel impact, confidence in the diagnosis, and implementation effort. Keep a record of the hypothesis, audience, page, primary event, stage metric, launch date, and decision. Apply the stated kill rule consistently, ending variants that remain below95% statistical confidence after two weeks of traffic, rather than allowing a weak test to occupy the team's attention indefinitely.
Treat activation as part of acquisition
The largest leak often appears after the signup. Free-trial-to-paid conversion is around8% for a median SaaS company, while top-tier card-required trials can exceed25%, according toSaaS KPI benchmarks. Self-serve trial-to-paid rates typically fall between15% and 25%, and top-performing products can exceed30%, according toSaaS marketing measurement guidance. These benchmarks aren't a verdict on your product, but they are useful signals that traffic quality and activation need joint review.
Map the product action that predicts retention. It might be a completed workflow, a connected integration, an invited teammate, or another behavior specific to the product. Design onboarding to reach that moment in under ten minutes when the product allows it, then measure the path rather than assuming signup equals intent.
Behavior should control lifecycle follow-up:
- Skipped setup: Send guidance that removes the first implementation obstacle.
- Completed core workflow: Reinforce the outcome and suggest the next valuable action.
- Sent an invite or connected an integration: Evaluate whether a sales touch adds value for that motion.
- Reached the paywall without activation: Fix the experience before increasing acquisition.
Instrument activation rate, time-to-value, and trial-to-paid conversion as one funnel in the CRM. Route upgrades into the correct revenue motion, then review whether the source channel produces retained customers, not just initial conversions.
A Measurement Plan Across Ads, SEO, and CRM
Attribution becomes less political when each system has a defined job. GA4 should describe paid entry and on-site behavior. Google Search Console should explain organic clicks and query intent. The CRM should hold qualification, opportunity, closed-won, and revenue truth.
| Measurement Layer | Owns | Primary Metric |
|---|---|---|
| GA4 | Campaign traffic, landing-page behavior, conversion events | Qualified conversion event |
| Google Search Console | Organic queries, pages, clicks, and search intent | Qualified organic entry |
| CRM | MQL, SQL, opportunity, and Closed-Won stages | Pipeline and revenue |
| Finance or billing data | Cash collection and gross-margin inputs | Payback period |
Use a consistent UTM convention covering source, medium, campaign, content, and audience or motion. Connect those values to the CRM record so the team can join ad spend to qualified stages and eventually to closed deals. Don't rely on a platform-reported conversion that stops at the form.
A practical cadence keeps the data useful:
- Daily: Review spend, signups, MQLs, and obvious tracking breaks.
- Weekly: Review SQL creation, pipeline movement, lead quality, and stage conversion.
- Monthly: Review CAC payback by channel, motion, and cohort.
Retire vanity sessions and last-click conversion as primary decisions. They can remain diagnostic fields, but they shouldn't determine budget allocation when qualified pipeline and payback are available. TheCRM and marketing integration guide provides a useful reference for connecting marketing activity with revenue stages.
Resolve conflicting numbers by hierarchy
When GA4, ad platforms, Search Console, and the CRM disagree, don't average the figures. First check date ranges, attribution windows, duplicate events, timezone settings, and stage definitions. Use ad platforms for delivery, GA4 for behavior, Search Console for organic discovery, and the CRM for revenue.
Document the discrepancy and assign one owner to resolve it. The team needs a shared operating definition more than another dashboard. A trustworthy imperfect model beats several precise-looking systems that answer different questions.
Running Acquisition as a Growth Operations System
Acquisition should run on an operating cadence, not a campaign calendar. The team doesn't need twelve simultaneous experiments. It needs a clear constraint, a named owner, and a decision based on evidence.
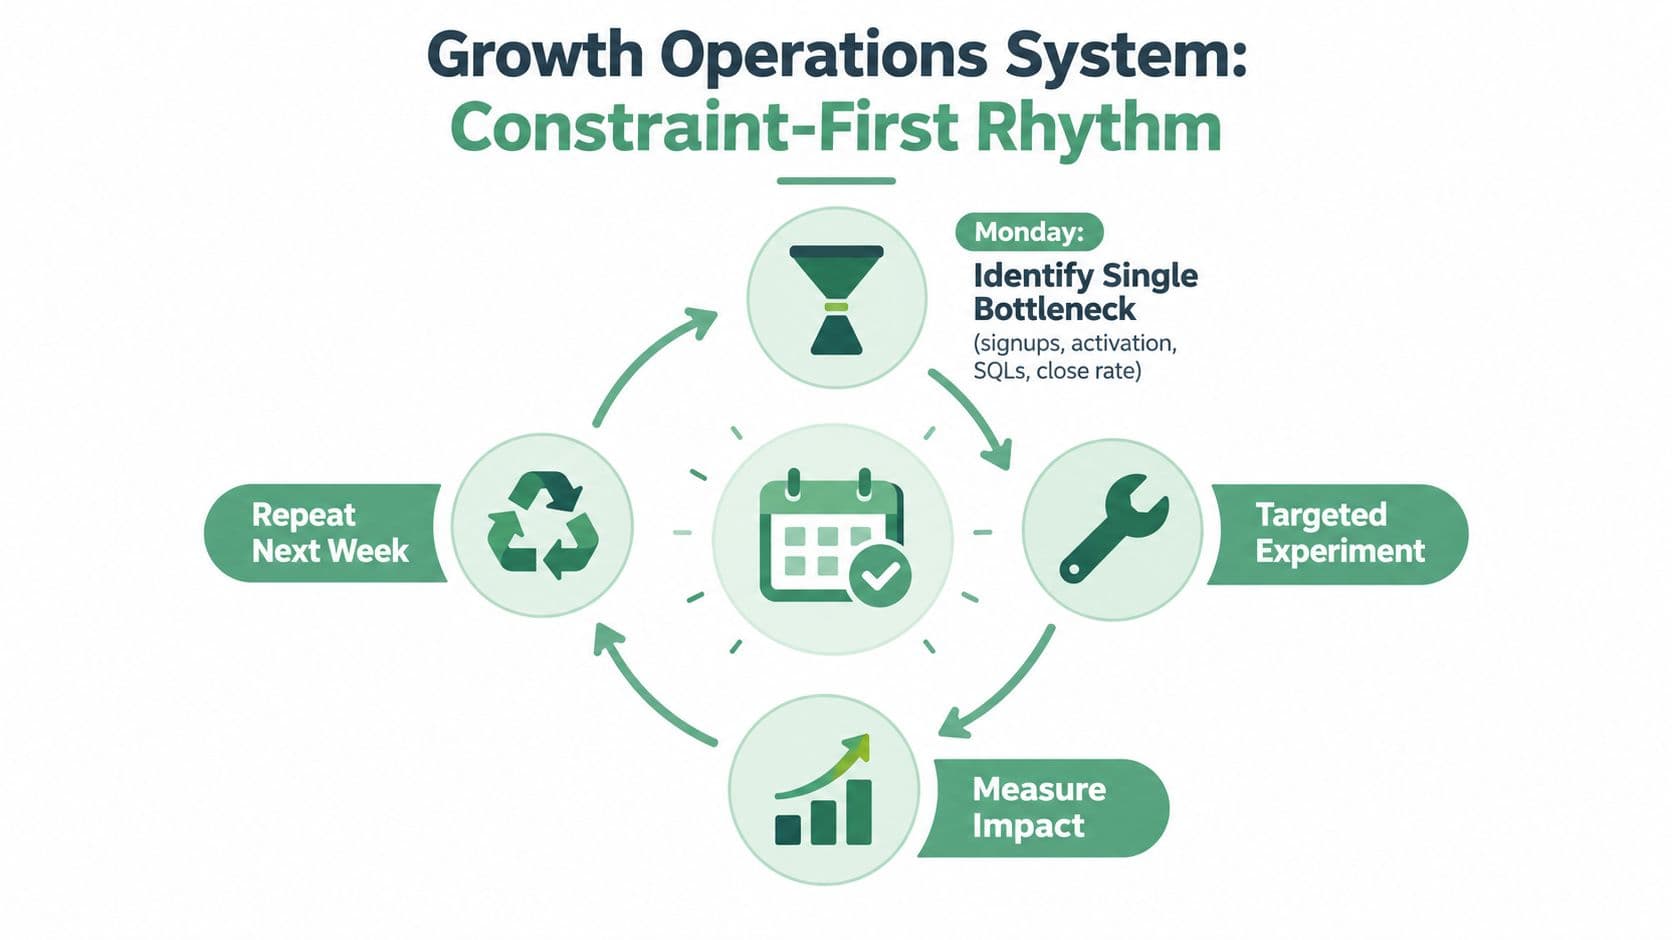
The weekly rhythm can stay simple:
- Monday, identify one bottleneck. Choose among signups, activation, SQL creation, or close rate.
- Tuesday, assign one targeted experiment. Change the part of the system most likely to affect that constraint.
- Friday, measure impact. Compare the result with the relevant payback and quality target.
- Next week, scale, iterate, or kill. Record the decision and move to the next constraint only when the evidence supports it.
The core roles are a growth lead, paid acquisition owner, lifecycle owner, and analyst. One person can cover several roles on a smaller team, but ownership still needs to be explicit. The weekly artifacts are an experiment log, a payback snapshot, and a channel scorecard showing spend, qualified stages, activation, pipeline, and revenue.
Operating rule: One source of truth, one bottleneck per week, one owner per channel, and immediate retirement of work that doesn't improve payback or lead quality.
Bring in an accountable growth operations partner when traction exists but the team can't standardize the loop, attribution remains contested, or payback has exceeded target fortwo consecutive quarters while internal hypotheses are exhausted. The partner's role should be practical: connect acquisition to product usage and sales signals, establish definitions, improve measurement, and help the team run the cadence. Crescade positions its work around an AI-assisted Growth Operations system that connects paid acquisition, SEO, conversion, lifecycle marketing, CRM, analytics, and automation, with people setting strategy and approving what ships.
Run the next quarter with constraint-first decisions. If a channel can't show how it improves qualified pipeline, activation, or payback, it shouldn't receive more budget because it produces activity.
Crescades can help connect paid acquisition, SEO, conversion, lifecycle marketing, CRM, analytics, and automation into one measurable SaaS growth system. VisitCrescade to discuss the bottleneck in your funnel and request a practical path toward better lead quality and payback.