- saas demand generation
- demand generation
- b2b lead generation
- saas marketing
- growth operations
SaaS Demand Generation Playbook for 2026
By Crescade · · 16 min read
A practical SaaS demand generation playbook covering channel mix, content, paid media, funnels, enablement, and measurement to drive qualified pipeline.
Most SaaS teams don't have a traffic problem. They have astage problem. They optimize visitor-to-lead conversion, celebrate MQL volume, and then discover that qualification, routing, onboarding, or product adoption is destroying the pipeline. A better SaaS demand generation program treats the funnel as an operating system, connecting acquisition, qualification, activation, expansion, and revenue measurement. The tradeoff is simple: you'll produce fewer vanity metrics, but you'll have a clearer view of which channels and offers create qualified pipeline.
Table of Contents
Where the Funnel Breaks Before Sales Gets Involved
Choosing the Right Channel Mix by Intent
Designing Offers and Landing Pages That Convert
Why Activation Is the Primary Demand Generation Constraint
Building a Closed-Loop Measurement Path
Operating Cadence and Next Steps
What SaaS Demand Generation Actually Means in 2026
SaaS demand generation isn't just lead generation with more channels.Lead generation captures existing intent. Demand generation creates familiarity, preference, and qualified movement toward revenue. Growth marketing is broader, often covering acquisition, experimentation, retention, and product growth. Brand marketing builds recognition and trust. Demand generation connects those activities to identifiable stages in the revenue journey.
The operating model has four stages:
- Capture: Attract relevant prospects through paid search, SEO, content, social, partners, and product-led entry points.
- Qualify: Separate genuine fit and intent from casual engagement, then route the right accounts to sales or self-serve journeys.
- Activate: Move a prospect or account to a meaningful product, demo, or onboarding milestone.
- Expand: Use adoption, account context, and lifecycle signals to support renewals, upsells, cross-sells, and advocacy.
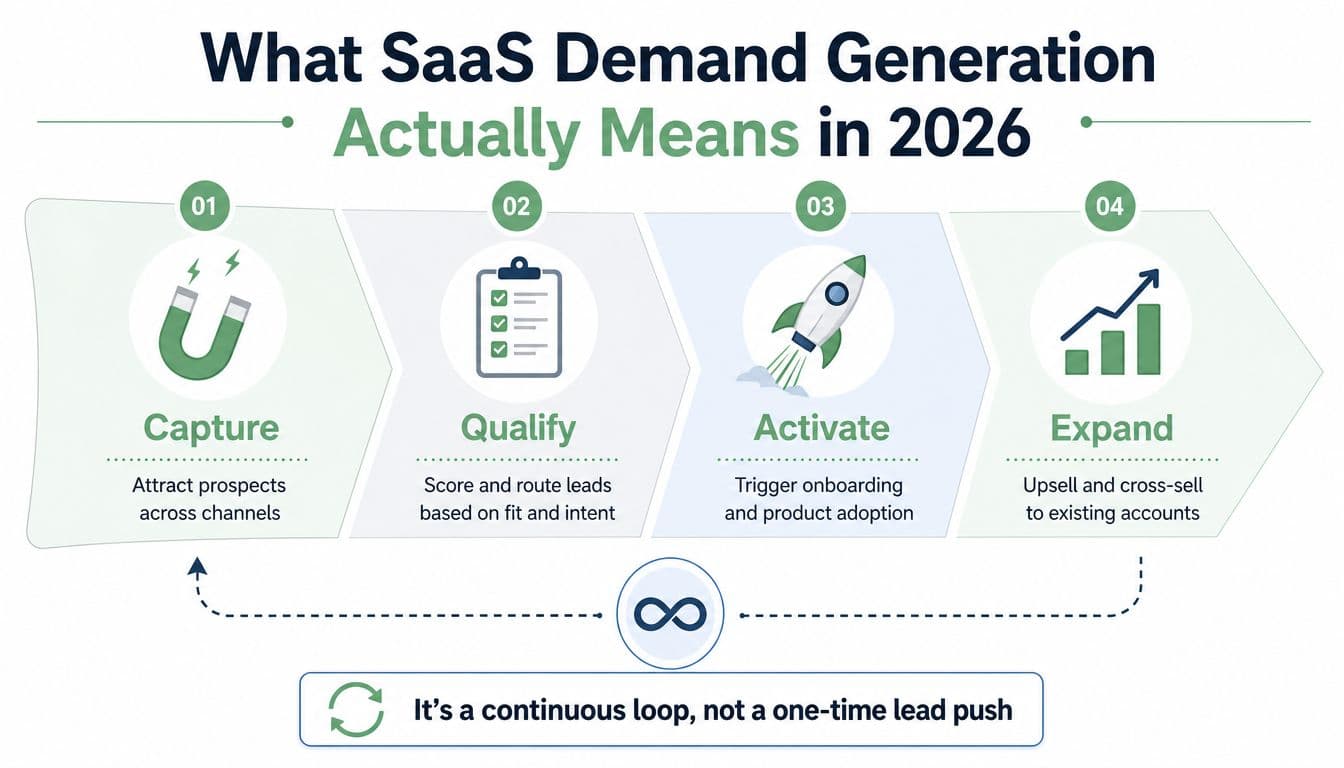
Each stage needs its own outcome. Capture should be judged by relevant traffic and conversion. Qualification should be judged by sales acceptance, opportunity creation, and routing quality. Activation should be judged by meaningful usage or a completed buying milestone. Expansion should be tied to account revenue and retention signals, not email engagement alone.
The 2026 trap
The most common mistake is improving the first conversion while ignoring what happens next. A form fill can look efficient while sales receives poor-fit contacts, reps respond slowly, and trial users never reach a meaningful product event. That program hasn't improved demand generation. It has improved data collection.
A benchmark aggregation reports amedian visitor-to-lead conversion rate of 2.35%,lead-to-opportunity conversion of 13%,opportunity-to-customer conversion of 22%, and an overallvisitor-to-customer conversion rate of 0.10% in 2026 (B2B SaaS lead generation benchmarks). The same source places average visitor-to-lead conversion between1.1% and 2.6%, depending on the source.
Practical rule: Don't scale the stage you can measure most easily. Scale the stage that limits qualified revenue.
A useful working definition is this:SaaS demand generation is the coordinated system that captures market attention, qualifies account intent, creates product or buying activation, and turns those signals into pipeline and expansion. The rest of the playbook operationalizes that definition through funnel diagnosis, intent-based channel planning, offer design, activation, closed-loop measurement, and operating cadence.
For broader context on building visibility before a buyer becomes active, theAutoSEO SaaS guide offers a useful perspective on how SEO supports the capture stage.
Where the Funnel Breaks Before Sales Gets Involved
The funnel usually breaks before sales receives a workable conversation. An ad platform can deliver traffic while the operating system fails at capture, qualification, routing, or activation. Common causes include assigning the wrong job to a channel, demanding too much information too early, and ending the handoff without a defined next action.
Qualification exposes the cost quickly. Salesforce's March 2025 State of Sales data, cited in a 2025 B2B benchmark summary, places average B2B SaaSsales-accepted lead rate at 26%, while the medianMQL-to-SQL rate is 13% (B2B lead generation platform benchmarks). The same benchmark reports amedian cost per MQL of $198, amedian cost per SQL of $762, and amedian 47-hour gap from MQL to first sales touch.
These figures point to three expensive leaks:
| Funnel Stage | Typical Benchmark | Most Common Leak Cause | Fix Direction |
|---|---|---|---|
| Capture | Visitor-to-lead median of 2.35%, see the benchmark above | Over-eager form gating or weak offer-message fit | Match the offer to intent and remove unnecessary friction |
| Qualify | MQL-to-SQL median of 13%, see the 2025 benchmark summary above | Loose definitions, weak scoring, or poor routing | Define fit, intent, ownership, and service-level expectations |
| Activate | A large share of PLG free users never reach activation | A signup is treated as success without an onboarding path | Track the first meaningful product event and intervene quickly |
Leak one, excessive form friction
B2B marketing teams often gate a lightweight educational asset with a form built for an enterprise buying committee. That suppresses capture from early-stage researchers and encourages incomplete or inaccurate submissions. Use short forms for low-intent assets. Enrich records later when a prospect requests a demo, pricing information, assessment, or implementation conversation.
Leak two, routing latency
A qualified hand-raiser loses value when no owner is obvious. Set routing rules for account fit, geography, segment, product interest, and sales capacity. The CRM should record qualification, assignment, first touch, and disposition timestamps. That record separates weak demand quality from an operational delay and makes response-time ownership visible.
Leak three, weak activation handoffs
Qualification alone does not create value. Trial users need a clear first action. Demo attendees need a relevant next step. Multi-stakeholder accounts need an invitation path that helps the champion involve the buying group. Activation belongs in the shared operating model across marketing, sales, product, and customer success.
Track each stage as an operating constraint, not as an isolated conversion rate. A higher lead count cannot compensate for slow qualification or an absent product milestone. Repair the stage that limits qualified revenue before adding another channel.
Choosing the Right Channel Mix by Intent
Channel selection should follow buyer intent and the next operating stage, not platform popularity or the lowest reported CPL. Paid search captures existing demand. SEO and content support durable discovery. Paid social creates exposure among a defined ICP. Partners add trust. Lifecycle marketing converts and activates people the business has already earned.
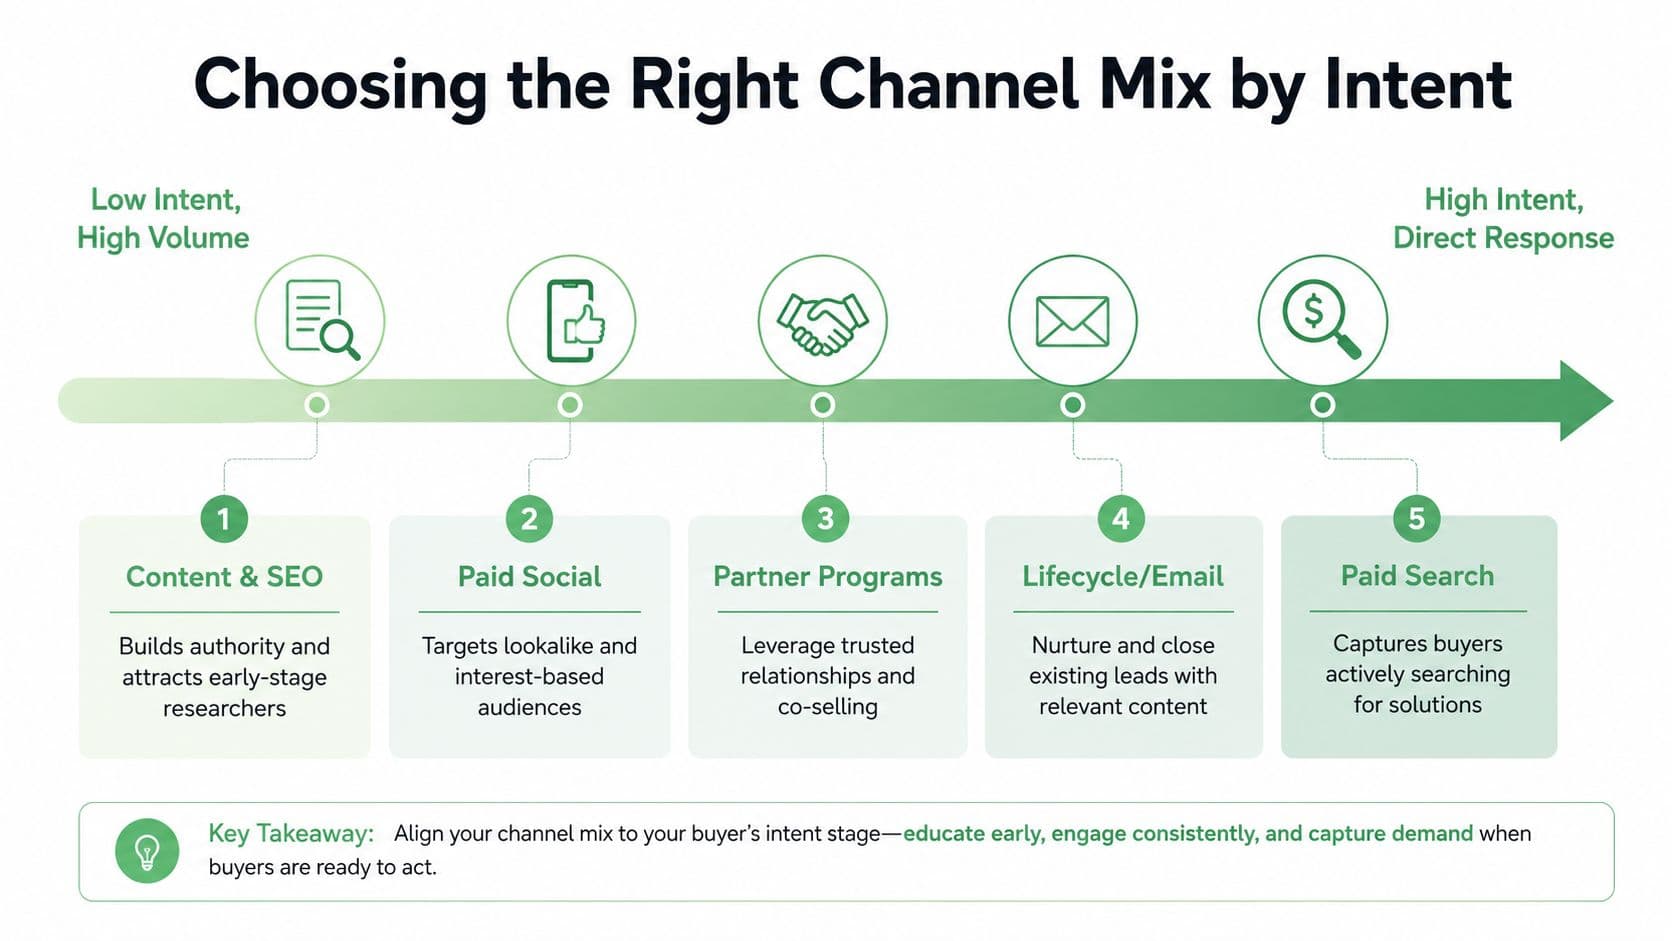
Assign every channel a primary stage before assigning budget:
- Capture: Use paid search for category, problem, competitor, and pricing intent. Use content and SEO for researchers who are not ready to talk. Use paid social for reach within a tightly defined ICP.
- Qualify: Use retargeting, comparison pages, webinars, partner referrals, and intent-aware forms to produce clearer evidence of fit.
- Activate: Use email, product onboarding, sales sequences, in-app prompts, and customer education to move an account toward a meaningful product or buying milestone.
- Expand: Use lifecycle programs, account-based content, customer advocacy, and usage-triggered outreach to support broader adoption.
Deal complexity should shape the mix. Lower-ACV, self-serve products can rely more on search, product-led entry, and automated lifecycle flows. Higher-ACV products need stronger account selection, comparison content, partner influence, sales enablement, and multi-threaded activation. Treat this as a decision rule tied to the human interactions the buying process requires, not a fixed percentage allocation.
Compare channels on downstream evidence
One benchmark set reportsemail conversion around 2.1% (B2B lead generation benchmarks), while a separate benchmark set reportspaid search conversion around 1.5%. The same separate dataset reports website-to-lead conversion near2% to 3% and MQL-to-SQL conversion around13%. Prefilled lead-generation forms can reach6% to 13% conversion in LinkedIn-style benchmark data.
These figures support planning, not channel decisions. A low-friction form can increase conversions while weakening qualification. A smaller partner channel can produce fewer leads and better opportunities. Compare channels on activated accounts, SQLs, opportunities, and closed-won revenue. Add qualification latency to the scorecard, because a channel that produces intent but waits too long for follow-up will underperform in the operating system.
For a channel-by-channel framework, use Crescade's guide todemand generation channels. Teams also need a practical method forturning buyer intent into sales, especially when signals span anonymous visits, content engagement, and CRM activity.
Cut any channel that lacks a stage KPI and an accountable next step. Pipeline comes from measured progression, not activity volume.
Designing Offers and Landing Pages That Convert
Generic ebooks rarely solve a clear buying problem. Strong SaaS offers give the visitor a reason to act now and give the revenue team evidence about what the account cares about.
Start with the stage. Early researchers may respond to a playbook, newsletter, benchmark explainer, or educational webinar. Active evaluators need a comparison sheet, pricing guidance, ROI assessment, implementation plan, free trial, or demo. The page should make the exchange obvious. If the visitor gives more information, the offer must deliver more decision value.
| Funnel Stage | Offer Type | Intent Signal | Landing Page Element |
|---|---|---|---|
| Early capture | Playbook, newsletter, educational guide | Problem awareness | Clear promise, low-friction form, related content |
| Consideration | Webinar, comparison sheet, checklist | Category or vendor research | Specific agenda, proof matched to ICP, next-step CTA |
| Evaluation | ROI assessment, pricing guide, free trial | Active buying intent | Strong qualification logic, implementation context, sales or self-serve route |
| Activation | Onboarding session, product checklist, use-case template | First meaningful action | In-product or lifecycle prompt tied to the next milestone |
| Expansion | Account review, usage workshop, cross-sell assessment | Broader adoption or new need | Account-specific proof, stakeholder invitation, relevant offer |
Build one page around one decision
A landing page shouldn't ask visitors to choose between a demo, newsletter, trial, and unrelated resource. Give each page one conversion path. Put the core outcome above the fold, explain who the offer is for, show what the visitor receives, and make the next step unmistakable.
Use social proof that matches the buyer. An enterprise operations leader needs proof about implementation and governance. A technical evaluator needs integration and workflow detail. A founder may care more about time to value and operational simplicity. Generic logos don't compensate for mismatched evidence.
Let the form reflect the offer
A low-intent guide shouldn't require a full qualification interview. A pricing assessment can reasonably ask about team structure, use case, timing, and current process because those answers improve the experience. Repeat visitors should encounter progressive profiling rather than the same form every time.
Intent-weighted CTAs are more useful than one universal “book a demo” button. Let a high-fit, high-intent visitor speak to sales. Route a lower-fit researcher into nurture. Send a self-serve prospect toward trial onboarding. Qualification logic should create a better next step, not only reject people.
Why Activation Is the Primary Demand Generation Constraint
A signup is an input, not a demand-generation win. A completed demo has limited value if the buyer leaves without a relevant next step.Activation is the point where a prospect experiences enough value to continue the journey.
For B2B SaaS, activation may mean configuring a qualified workspace, connecting an integration, inviting a stakeholder, completing a core workflow, or reaching a meaningful usage milestone. The event varies by product, but it must be observable and tied to later pipeline or expansion outcomes. Define that milestone before judging channel performance.
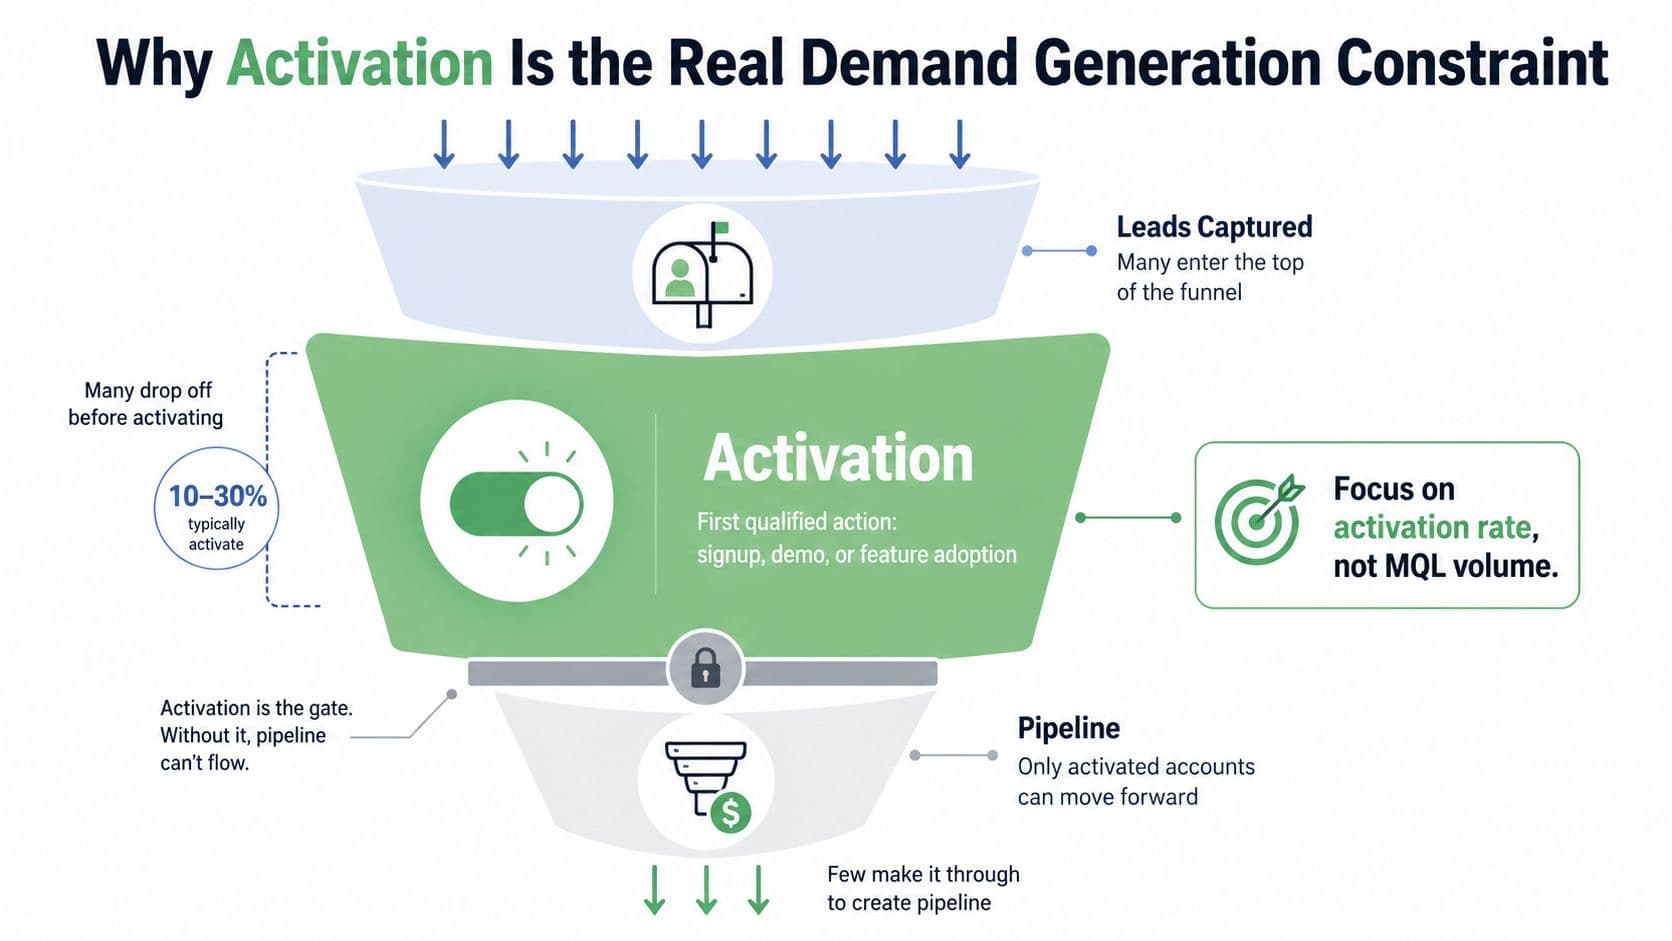
Research cited from the OpenView 2025 SaaS Pricing and PLG Index indicates that many PLG free users never reach activation, while activation tracking remains underused among PLG companies. As noted earlier, acquisition can look healthy while the product experience fails to convert interest into value. Lead volume hides that failure until pipeline stalls.
Make activation a shared metric
Marketing should pass product and sales more than a contact record. Include source, offer, account context, use case, and the expected activation event. Product and revenue operations should return usage signals to marketing, so future campaigns favor channels and messages that produce activated accounts.
Track:
- Activation rate: The share of qualified signups, demos, or trials reaching the defined milestone.
- Time to activation: The elapsed time from entry or handoff to first meaningful value.
- Activation by source: The quality difference between paid search, SEO, partners, social, and lifecycle.
- Activation by offer: Whether a comparison page, calculator, webinar, or trial attracts accounts that progress.
- Activation by ICP tier: Whether the program works equally well across target segments.
Crescade'sSaaS marketing automation framework supports this operating model because automation should respond to behavior, not merely form completion. A trial that has not connected an integration needs a different intervention from one that has invited several users. Set alerts and handoffs around the missing milestone, not the original conversion.
Qualification latency matters as well. Measure how long an activated account waits for review, routing, and sales follow-up. A strong activation signal loses value when operational delays push the buyer back into research.
Common mistakes remain predictable. Teams treat trial starts as outcomes, ignore time to activation, and optimize for demo volume instead of the usage or buying milestone that makes a deal more likely. Reallocate budget toward acquisition paths that produce activation, even when they generate fewer initial leads.
Building a Closed-Loop Measurement Path
Closed-loop measurement starts with a simple question: can you trace a qualified account from the first measurable touch to closed-won ARR without losing identity, stage, or source context?
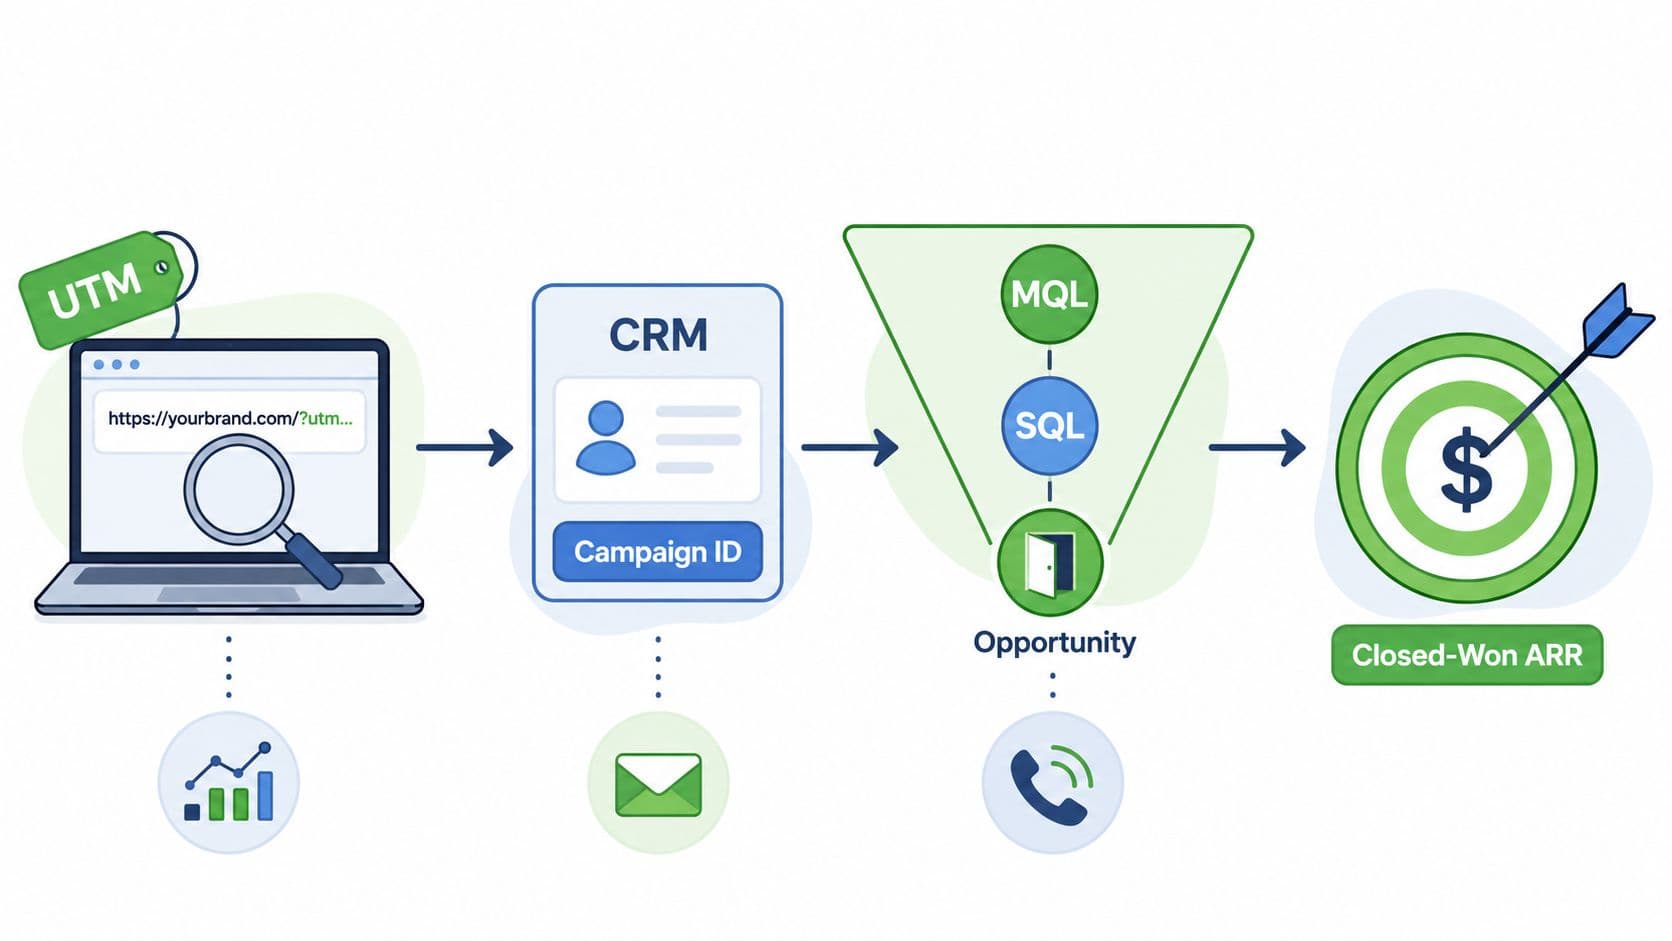
The technical chain should connect ad clicks, organic visits, form submissions, CRM campaign IDs, lifecycle stages, product events, opportunities, and closed-won outcomes. Use a consistent UTM taxonomy across Google Ads, paid social, partner links, email, and content distribution. Store the GA4 client ID and session-level UTM parameters in CRM contact records, then mirror CRM milestones back to GA4 through server-to-server events, as described in thisGA4 measurement setup for B2B SaaS.
Instrument the handoff
A practical setup uses:
- GA4 and Google Tag Manager to capture website activity and campaign context.
- CRM-neutral lifecycle stages for MQL, SQL, opportunity, activated account, and closed-won.
- CRM webhooks or server-side events to send milestone signals back into analytics.
- Account-level deduplication so multiple contacts from one buying group don't inflate performance.
- Product usage events connected to account and opportunity records.
- A revenue dashboard that lets leadership compare spend with qualified outcomes.
Anonymous visitor identification can add account context, but treat it as a signal rather than a perfect identity match. Reverse-IP or similar tools can help prioritize accounts, while authenticated product events provide stronger evidence once a user signs in or submits information.
Choose an attribution approach that matches your sales motion. A shorter, transactional cycle may support a more direct channel view. A complex account-based motion needs multi-touch or account-level analysis. One published implementation recommends using GA4's Data-Driven attribution and a lookback window aligned with the sales cycle (SaaS marketing attribution setup).
The dashboard should showspend, MQLs, activated accounts, pipeline created, ARR closed, and CAC payback by channel. Add cost per MQL, MQL-to-SQL conversion, marketing-sourced pipeline, marketing-influenced pipeline, marketing-sourced revenue, and return on marketing investment, which are among the revenue-tied metrics recommended for demand generation teams (B2B demand generation metrics).
Crescade's approach tofull-funnel marketing reflects the operating requirement here: acquisition, conversion, lifecycle, and analytics must share the same decision path.
Operating Cadence and Next Steps
A stage-based system needs a recurring management rhythm. Without one, teams return to channel-level reporting, debate attribution in isolation, and discover qualification problems only after pipeline misses.
Use this cadence:
- Weekly demand standup: Marketing reviews traffic quality, offer conversion, lead routing, activation signals, and open operational blockers. Owners should leave with one action per bottleneck.
- Weekly pipeline review: Marketing, sales, and revenue operations compare channel-level spend with SQLs, opportunities, pipeline created, and closed-won movement. Discuss account quality, not just campaign totals.
- Monthly experiment review: Choose one qualification, activation, landing-page, or lifecycle constraint. Keep the test narrow enough to identify the mechanism behind any change.
- Quarterly channel review: Rebalance channels by stage, ICP tier, activation quality, pipeline contribution, and efficiency. Don't protect a channel because it produces impressive reach.
- Quarterly systems review: Audit campaign naming, CRM fields, lifecycle definitions, event delivery, deduplication, and dashboard integrity.
A practical 12-week cycle starts with diagnosis, then moves into implementation and controlled iteration:
| Period | Primary Review | Owner | Output |
|---|---|---|---|
| Weeks 1 to 2 | Funnel definitions and baseline | Revenue operations | Shared stage map and data audit |
| Weeks 3 to 4 | Capture and landing-page friction | Demand generation | Offer and page experiment backlog |
| Weeks 5 to 6 | Qualification and routing | Marketing and sales operations | Scoring, ownership, and SLA changes |
| Weeks 7 to 8 | Activation and onboarding | Product marketing and product | Defined milestone and intervention paths |
| Weeks 9 to 10 | Channel quality | Performance and lifecycle teams | Budget decisions by activated pipeline |
| Weeks 11 to 12 | Attribution and executive reporting | Marketing operations | Revenue dashboard and next-quarter plan |
AI can support campaign production, routing recommendations, analysis, and workflow maintenance, but people still need to approve strategy, budgets, messaging, and customer-facing actions. For a useful perspective on the operating layer, reviewAdCrunch's AI marketing automation.
Within the next seven days, answer one diagnostic question:Which stage loses the greatest share of otherwise qualified accounts, and can your team prove it from connected data? If you can't answer, audit the funnel before increasing spend. Revisit channel mix when MQL-to-SQL performance is weak, activation isn't tracked, routing takes too long, account duplication distorts results, or no channel can be tied to qualified pipeline.
Crescade connects acquisition, landing pages, CRM signals, lifecycle marketing, analytics, automation, and AI-assisted execution into an accountable growth operations system for SaaS teams. VisitCrescade to evaluate the stage limiting your pipeline and request a 20-minute audit of your demand generation measurement path.